Graphical User Interface
iDaVIE presents two types of GUI: the Desktop GUI, which is the one the user will interact with while at the computer/desktop using the keyboard, and the VR GUI, which is the one the user will interact with in the VR environment using the VR controllers.
Desktop GUI
This is the GUI that the user uses to start the VR session. It is the first thing that appears to the user on the computer screen when iDaVIE.exe is executed.
The Desktop GUI is divided into two main sections: the left side, which includes options to display a view of the VR user or further information on iDaVIE, and the right side, which functions as the which is the main control panel. The control panel is divided into three tabs: FILE, RENDER, STATS, SOURCES and DEBUG.
Using this GUI the user can load the “data cube” of their choice by pressing the Browse button on the Image File line.
Once the cube is loaded, the user can do one or more of the following actions:
Check the header of the cube reported in the grey rectangle (in order to check if the software has interpreted the header correctly).
Tune the rendering of the cube using the options in the RENDERING tab or check some basics stats of the cube (these can also be done through the Main menu options in the VR GUI).
FILE tab
The FILE tab is what the user will see when iDaVIE is opened. This tab includes the options to load a cube, load a mask, read header information of the cube, and start the VR session.
NOTE: Users can also load cubes that have 4 dimensions. If a cube with four dimensions is loaded, the system will give the opportunity to choose which axis (3 or 4) to use based on the header of the cube. To select the Z axis, a drop down menu will appear listing the axes.

Button to display the desktop
VR View. This is the view that the user will see when the VR headset is worn. VR View is activated by default upon loading the cube.Button to display more iDaVIE information. This includes the version of the software, the authors, and the license.
Button to exit iDaVIE.
Click this Browse button to open the file explorer and select the cube file to load.
The header information for the selected data cube will be displayed here.
Optionally, you can click the Browse button to open the file explorer and select a mask file to load. NOTE: the mask must have the exact same dimensions of the cube loaded.
Click the Load button to start the rendering of the cube. A loading bar will appear at the bottom of the window to indicate load progress. Once this is done, the user can put on the headset and start exploring the cube.
RENDER tab
The RENDER tab includes options to tune the rendering parameters of the cube.

Dropdown menu to set a precalculated size for the cube side lengths. The default is
X=Y=Z, setting the cube to 1x1x1 size. The other option ofX=Ysets the X and Y lengths of the cube equal (to be a square) and sets the Z length to have the same ratio as the X and Z lengths of the data cube.Dropdown menu to set the applied colour map for the cube. The default is the Inferno colour map.
Slider to adjust the minimum threshold of the cube. This sets what data value will be both the lowest end of the colour map as well as an alpha value of 0.
Slider to adjust the maximum threshold of the cube. This sets what data value will be both the highest end of the colour map as well as an alpha value of 1.
This button resets the thresholds to the default values.
Dropdown menu to set the rest frequency of the cube. This is used to convert between frequency/wavelength and velocity units for spectral cubes. In addition to the dropdown options that are defined in the config file, the
Defaultoption uses the rest frequency defined in the cube header (if present) while theCustomoption allows the user to input a custom rest frequency.Input field to set the custom rest frequency. This is only available when the
Customoption is selected in the dropdown menu.The VR view active, showing what is shown in the virtual environment.
STATS tab
The STATS tab includes options to check and interact with some basic data statistics of the cube

Calculated histogram of the cube data. The histogram is calculated using the minimum and maximum scales below.
Common percentiles to set the minimum and maximum scales of the histogram. The default is 100% (which sets 0% for the minimum).
Input field to set the minimum percentile of the histogram. The default is the minimum value of the cube. Press enter to update the histogram.
Input field to set the maximum percentile of the histogram. The default is the maximum value of the cube. Press enter to update the histogram.
Dropdown to mark the different sigma levels in the histogram. The default displays 1 sigma.
Button to set all of the above options to their default values.
SOURCES tab
The SOURCES tab includes options to load a catalog of sources. The catalog can be in a VOTable .xml format or a .fits table.

Click this Browse button to open the file explorer and select the catalog file to load.
Optionally, click this browse button to select and apply a mapping
.jsonfile that was saved from a previous session.These are the names of the columns in the source file.
Dropdown menu to select where to map the indicated column. This includes position (x,y,z image coordinates or wcs astronomy coordinates) for point sources, but box corners can also be mapped (currently only for x,y,z image coordinates). A name column can also be indicated.
Tick this box to import the indicated column for display in the VR source info box when the source is selected in the scene.
Click this button to save the chosen mappings and import ticks as a
.jsonfile for later use.Click this Load button to load the source file with the chosen mapping. This will be greyed out if insufficient mappings for position coordinates are selected.
Tick this box to exclude sources that are not within the cube bounds. This is useful for large catalogs that may extend far outside the cube.
Message indicating if the source file was successfully loaded.
DEBUG tab
The DEBUG tab includes a readout of the debug log for the current session. This is useful for troubleshooting issues with the software.

Readout of the debug log.
Button to save the log to a location of the user’s choosing.
VR GUI
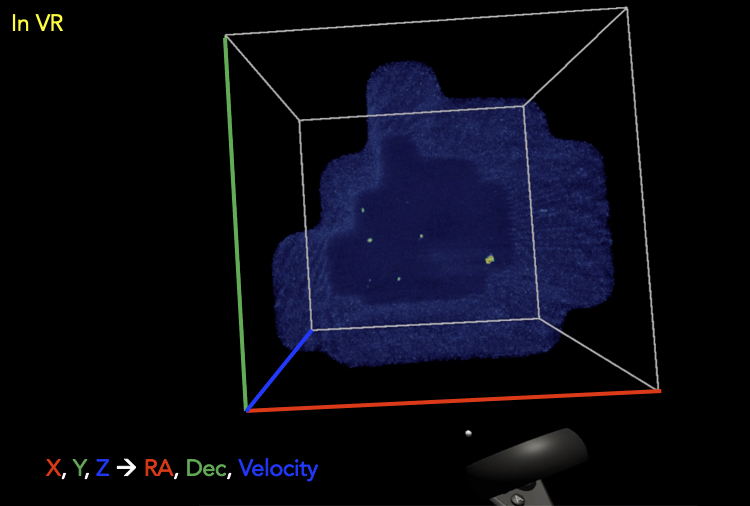
After loading a file in the FILE tab, the user can put on the headset. The first image the user sees will be something like this:
The axes are RGB colour-coded as (for example):
Red, Green = X, Y (e.g., RA, DEC respectively)
Blue = Z (e.g., velocity or redshift)
Quick menu
The Quick menu is the main menu the user will interact with in the VR environment. It is invoked by holding the main thumb button on the secondary controller. A pointer from the primary controller can then be used to make button selections using the trigger button. The various buttons are detailed below.

Open the Source List Window.
Open the Plots Window.
Open the Voice Command Window.
Open the Settings Window.
Open the Colourmap Winow.
Open the Mask painting menu and start mask painting mode.
Save the mask to file.
Toggle to crop the cube to the selected region or uncrop the cube if already cropped.
Toggle the mask application options (voice command analogue in brackets). Options are to subtract the unmasked regions (“mask on”), subtract the masked regions (“mask invert”), show the mask by itself (“mask isolate”), or show the cube without the mask (“mask off”).
Take a screenshot of the current view.
Exit iDaVIE.
Mask painting menu
In the mask painting mode, the user can paint the mask using the controllers. The primary controller is used to paint the mask and adjust the brush size, while the secondary controller can be used to undo/redo brush strokes. Masks work by numbering voxels as integers corresponding to the Source ID of the masked region. Non-masked voxels are numbered as 0. Once started, the Mask painting menu will open on the secondary controller. The various buttons for the menu are detailed below.
NOTE: Paint mode can only be started if the cube is at full resolution. If the cube is not at full resolution, the user will be prompted to increase the resolution before starting paint mode by cropping the cube.

Activate additive brush mode. This allows the user to add to the mask by painting with the primary controller. The value of the mask is set to the current Source ID that will be indicated at the top of the menu.
Activate subtractive brush or eraser mode. This allows the user to subtract from the mask by painting with the primary controller. The value of the mask is set to 0 in this mode.
Increase the brush size by increasing the voxel number of the brush head. This can also be done by moving the thumbstick of the primary controller up.
Decrease the brush size by increasing the voxel number of the brush head. This can also be done by moving the thumbstick of the primary controller down.
Reset the brush size by setting the brush head to a single voxel.
Toggle the mask outline on or off. This is useful for seeing the mask in the scene overlayed on the cube. This is on by default.
Toggle the mask application to subtract the masked regions, subtract the non-masked regions, or show the mask itself.
Undo the last brush stroke.
Redo the last undone brush stroke.
Save the mask to file.
Set the
Source IDto a new number, effectively adding a new masked source to paint in the scene. These start at 1000 and increment by 1 for each new source.Enable source-selection mode. This allows the user to select sources in the scene by pointing at them with the primary controller and pressing the trigger.
Open the Source List Window. This can be useful for observing changes in the Info Window as sources are changed with painting
Open the Plots Window. This can be useful for observing changes in the calculated moment maps or spectral profiles as sources are changed with painting.
Exit mask painting mode. You will be prompted to save if the mask has been changed.
Source List Window
This window displays the three types of sources that can be used with iDaVIE: mask sources, imported catalog sources, and new sources. The user can select a source from the list to see the source information in the Info Window. The user can also select a source to see the source in the scene. The various buttons and features for the menu are detailed below. White buttons (1-5, 19) correspond to interactions with individual sources and yellow buttons (9-13, 16-17) correspond to interactions with the entire source list.

Button to select the indicated source.
Button to teleport the user to the indicated source.
Button to toggle the visibility of the indicated source.
Button to toggle the flag of the indicated source to a string value of the user’s choice. By default these are
-1,0, and1. The available flag strings can be changed in the config file.Button to add the indicated source to the New List.
This bar shows the applied colour of the current source list.
Each source in a list has an integer value associated with it.
Scroll button to view more sources in the list. The list can also be scrolled by moving the thumbstick up and down while the laser pointer is hovering over the list.
Button to open the info window to see more information about the selected source.
Button to change the colour of the current source list.
Button to make the current source list visible.
Button to hide the current source list.
Button to save the current source list to an iDaVIE VOTable
.xmlfile.Source name will appear here for all lists. For imported sources, this can be assigned to a column with the dropdown in the SOURCES tab of the Desktop GUI.
The name of the list will appear here. For imported sources this will be the file name.
For imported sources, this button populates the menu with the previous list.
For imported sources, this button populates the menu with the next list.
Source name will appear here for all lists. For the New List, this will take the original name of the added source.
Button to remove the indicated source from the New List.
Source Info Window
The Source Info window displays the information of the selected source. This includes basic info, calculated stats (in the case of mask sources), and imported columns (in the case of imported sources).
Note: The location of the stats calculation for masked sources code is located here in the iDaVIE repository.

The number of the source in its list.
Information about the position of the source. This will either be the weighted centroid (in case of mask sources) or the physical centre of the box (in the case of imported and selection boxes).
The calculated sum of the data values for masked sources. This is the integrated intensity of the source.
The calculated peak data value of the masked source.
The calculated the source’s systemic velocity, or the velocity of its centroid (in voxel units).
The calculated spectral line width at 20% of the peak intensity of the source (in voxel units).
The calculated the source’s systemic velocity, or the velocity of its centroid (in physical units).
The calculated spectral line width at 20% of the peak intensity of the source (in physical units).
The current flag of the source. This can be set in the Source List window.
Settings Window
The Settings window allows the user to adjust the rendering settings of the cube and other minor interaction options.

Arrow buttons to change the applied colour map of the cube.
Sets the colour map to the default, which is
Inferno.Arrow buttons to change the scaling function of the applied colour map. These include
linear,log,sqrt,x^2,power, andgamma correction. The location of the scaling function code is located here in the shader code of the iDaVIE repository.Sets the scaling function to the default, which is
linear.Adjust the minimum threshold of the cube. This sets what data value will be both the lowest end of the colour map as well as an alpha value of 0.
Reset the minimum threshold to the default value, which is the minimum scale value of the histogram.
Adjust the maximum threshold of the cube. This sets what data value will be both the highest end of the colour map as well as an alpha value of 1.
Reset the maximum threshold to the default value, which is the maximum scale value of the histogram.
Scroll through the different rest frequencies of the cube. This is used to convert between frequency/wavelength and velocity units for spectral cubes. The values include Default (rest frequency from the cube header), Custom (user input rest frequency), and the values defined in the config file.
Choose the primary hand for the user. This can be set to left or right.
Set the steps of the moment map threshold adjustment. When the user adjusts the custom threshold for the moment maps in the Plots menu, this number will be the step size.
Open the Keypad to input a custom moment map threshold step size.
Plots Window
The Plots window gives the user access to useful 2D plots calculated in realtime for the cube.
NOTE: The Spectral Profile can currently only be viewed for masked sources that are selected. This will be expanded in the future, but in the meantime, you can view the spectral profile of any region by creating a new source and painting the voxels.

Displays the moment 0 map of the currently cropped region of the cube. The moment 0 map is the integrated intensity of the cube.
Displays the moment 1 map of the currently cropped region of the cube. The moment 1 map is the intensity weighted velocity field of the cube.
NOTE: The code for the moment map calculation is located here in the iDaVIE repository.
The colourbar for the moment maps. Colour settings can be adjusted in the config file using the
momentMaps.m0.colorMapandmomentMaps.m1.colorMapsettings.What voxels to include for the moment map calculations. This can be set to Threshold which uses the threshold data values set below or Mask which uses the mask to exclude voxels.
The minimum threshold for the moment map calculations. This sets the minimum data value to include in the moment map calculations.
Open the Keypad to input a custom threshold value.
Select whether to use ZScale or MinMax scaling the colour maps to the calculated moment maps. ZScale is the default scaling function. MinMax simply scales the colour maps to the minimum and maximum data values of the moment maps.
Save the moment maps to a
.pngimage with the colour bar included. The image will be saved to the Outputs directory,Output/MomentMaps/Moment_map_yyyyMMdd_Hmmss.png, whereyyyyMMdd_Hmmssis the timestamp when the file is saved.Save the moment maps to two separate
.fitsimages with units embedded. The images will be saved to the Outputs directory,Output/MomentMaps/Moment_map_[0/1]_yyyyMMdd_Hmmss.fits, whereyyyyMMdd_Hmmssis the timestamp when the files are saved.Edit the min/max bounds of the histogram. This will also set the minimum and maximum data values where the colourmap scales. This should be adjusted at the beginning of the session while Threshold adjustments should be used for “fine tuning” with the controllers.
Open the Keypad to input a custom min/max scale value.
Button to apply the new min/max scales for the histogram.
Button to reset the min/max scales to the default values, which are the min/max data values of the cube.
Save the Spectral Profile to a
.csvfile in the Outputs directory.
Keypad
The Keypad is a virtual keypad that can be used to input custom values for the moment map thresholds and the min/max scales of the histogram. The user can use the primary controller to point at the buttons and the trigger to enter the number and click Confirm to apply the value.

Voice Command Window
The Voice Command window displays the available voice commands that the user can use in the VR environment. The user can say the command to the headset microphone to activate the command. A manual override button for each command is also available in the window.

Click the arrow button to manually activate the voice command.
Use the scroll buttons to view more voice commands. The list can also be scrolled by moving the thumbstick up and down while the laser pointer is hovering over the list.
Colourmap Winow
The Colourmap window displays the available colour maps that the user can apply to the cube. iDaVIE makes use of the colourmaps available in the matplotlib Python library. See the matplotlib documentation for more information on the available colour maps.

Click the arrow button to apply the colour map.
Use the scrolls buttons to scroll through the available colour maps. The list can also be scrolled by moving the thumbstick up and down while the laser pointer is hovering over the list.
Controller Cursor Info
The 3D cursor will provide information about the current voxel under the cursor. If a mask is loaded, then the cursor info will also provide feedback on the identified sources. Selection and threshold adjustment modes also give temporary feedback on the cursor info.

The cursor itself is a small sphere that will follow the controller position. When inside the cube, individual voxels will be highlighted by the cursor with a green outline. This indicates what voxel the information will be displayed for.
WCS sky coordinates of the voxel under the cursor. This will be calculated using information from the cube header.
WCS spectral coordinate of the voxel under the cursor. This will be calculated using information from the cube header.
Image coordinates of the voxel under the cursor. This is the voxel index in the cube and is 1-indexed.
Data value of the voxel under the cursor. The unit is determined by the cube header.
The alternate spectral coordinate of the voxel under the cursor. This is calculated using the rest frequency of the cube and the spectral coordinate.
The red microphone icon indicates that voice commands are currently inactive. This could be due to the user being in push-to-talk mode without the talk button (secondary thumb button on primary controller) pressed or the iDaVIE window is not in focus.
iDaVIE window focus indicator. This will be present if the iDaVIE window is not in focus. This can be resolved by clicking on the iDaVIE window on the desktop. If this is present, voice commands will not be active.
The Source ID of the voxel under the cursor. This will not be visible if the voxel is not part of a mask source.
The green microphone icon indicates that voice commands are currently active. This will be present when the user is in push-to-talk mode and the talk button is pressed.
While in threshold adjustment mode, the Min value is displayed here. This is the minimum data value both where the colourmap will start and where the alpha value will be 0.
While in threshold adjustment mode, the Max value is displayed here. This is the maximum data value both where the colourmap will end and where the alpha value will be 1.
While in selection mode, the Region shows the voxel dimensions of the selected region.
While in selection mode, the Angle shows the calculated angle across the sky of the selected region. The angle will be from corner to corner of the selection box (start to end).
While in selection mode, the Depth shows the calculated depth of the selected region. This is the distance between the start and end of the box in the Z direction.